
SPATIALIST - SDI for Public Sector Innovation (2007-2011)
This is an extract from the book chapter ‘Vancauwenberghe, G., Crompvoets, J., Bouckaert, G., & Vandenbroucke, D. (2011). Social Network Analysis of the SDI in Flanders. In: Nedovic-Budic Z., Crompvoets J., Georgiadou Y. (Eds.), Spatial Data Infrastructures in Context: North and South, Chapt. 6 CRC Press Taylor & Francis Group, 121-135’. The full chapter can be found here
In the book chapter ‘Social Network Analysis of the SDI in Flanders’, social network analysis was used to study the network of spatial data exchanges between spatial data users and producers in Flanders. The method was applied to measure the density and the centralization of the network and the centrality of the actors in this network.
Data needed for this network analysis were collected through an online questionnaire sent to 508 public organizations in Flanders (Belgium). All regional, provincial, and municipal authorities in Flanders were invited to participate in this survey. In addition, a selection of federal organizations, intermunicipal organizations, and harbors was also invited. Private organizations and nonprofit organizations were left out because the focus was on the exchange of spatial data within the public sector.
The main objective of the study was the identification of spatial data flows among public organizations. In order to identify these data flows in a clear and unambiguous manner, four specific types of spatial data were selected: parcel data, address data, road data, and hydrographic data. For each spatial data type, organizations were asked to indicate whether they used, produced, and/or received these data. In case they received a certain type of data from one or more other organizations, they were requested to identify the suppliers.
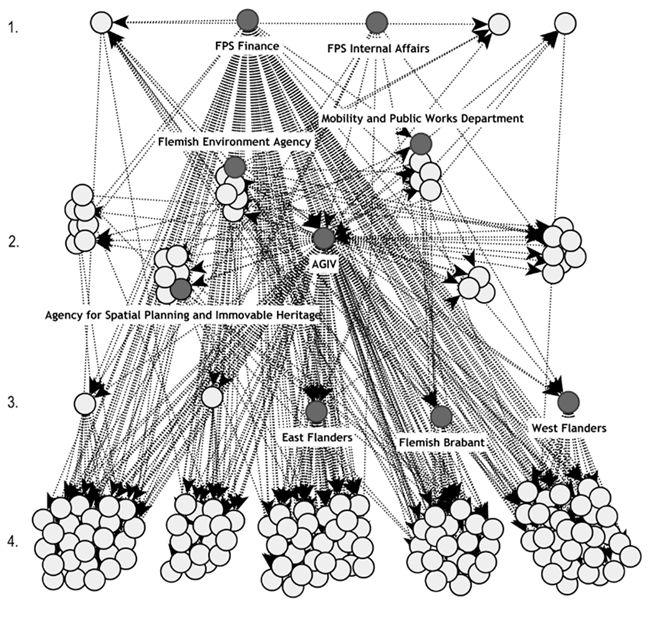
Based on the collected data, the network of spatial data exchanges in Flanders (Belgium) was analyzed in a graphical and a mathematical manner. A graphical representation of the SDI network is presented in the figure above. In this figure, all organizations are represented as nodes, while their relational ties are represented by lines. The actors in this network are positioned by their administrative levels. Four levels can be distinguished: (1) the Belgian federal organizations (at the top), (2) the organizations of the Flemish public administration, (3) the five provinces, and (4) the municipalities (at the bottom row). Between these organizations, 410 lines can be discerned. These lines refer to the exchange of at least one type of spatial data. Even organizations that exchange more than one type of data are linked with only one line in the figure. However, if we consider each type of data as a distinct relational tie and allow organizations to be connected by multiple ties, the total number of ties becomes 713. The most central actors in the network are marked and identified.
The study demonstrated that social network analysis can provide insight into the impact of different arrangements on the access to and the exchange of spatial data. Of the analyzed data, 80% were facilitated by one of the main SDI arrangements. In addition, the study illustrated how social network analysis could be used to analyze the interactions between these different arrangements. For instance, the graphical network analysis of the SDI showed that, to a certain extent, these arrangements were complementary to each other—in the sense that they redistributed each other’s data to specific groups of users. The analysis demonstrated that the Flemish SDI is partly hierarchically organized because data from higher administrative levels are distributed by lower administrative levels. It is worth noting that social network analysis can be used to reveal the hierarchical characteristics of an SDI in an empirical, quantitative manner. At the same time, social network analysis was useful in demonstrating the overlap between the different SDI arrangements, since the method allowed to illustrate that identical or similar types of spatial data were provided by multiple arrangements to the same users.
The Social Network Analysis of the SDI in Flanders was part of the PhD research on the ‘Coordination within Spatial Data Infrastructures’. In my PhD research I explored how different coordination instruments and mechanisms could be used to coordinate the exchange of, the access to and to use of spatial data. The study employed a mixed method research design, combining and mixing quantitative and qualitative research methods. The quantitative part of this study included the social network analysis but also a longitudinal analysis of the coordination of GIS in Flemish municipalities. The qualitative part of the study consisted of three case studies, focusing on the exchange of, access to and use of one type of spatial data. The empirical analyses demonstrated how hierarchy-based, market-based and network-based coordination contributed to achieving coordination in the exchange of, access to and use of spatial data. The policy relevance of this study went beyond demonstrating the importance of and the need for coordination in the development of these infrastructures. The results of this study indicated how a successful coordination strategy should be a combination of different coordination mechanisms. While the deployment of network-based coordination may contribute to a further exploitation of the potential of spatial data, hierarchy-based and market-based forms of coordination remain valuable and should not be overlooked.